Hi @zbyszek and @jacob-thomas
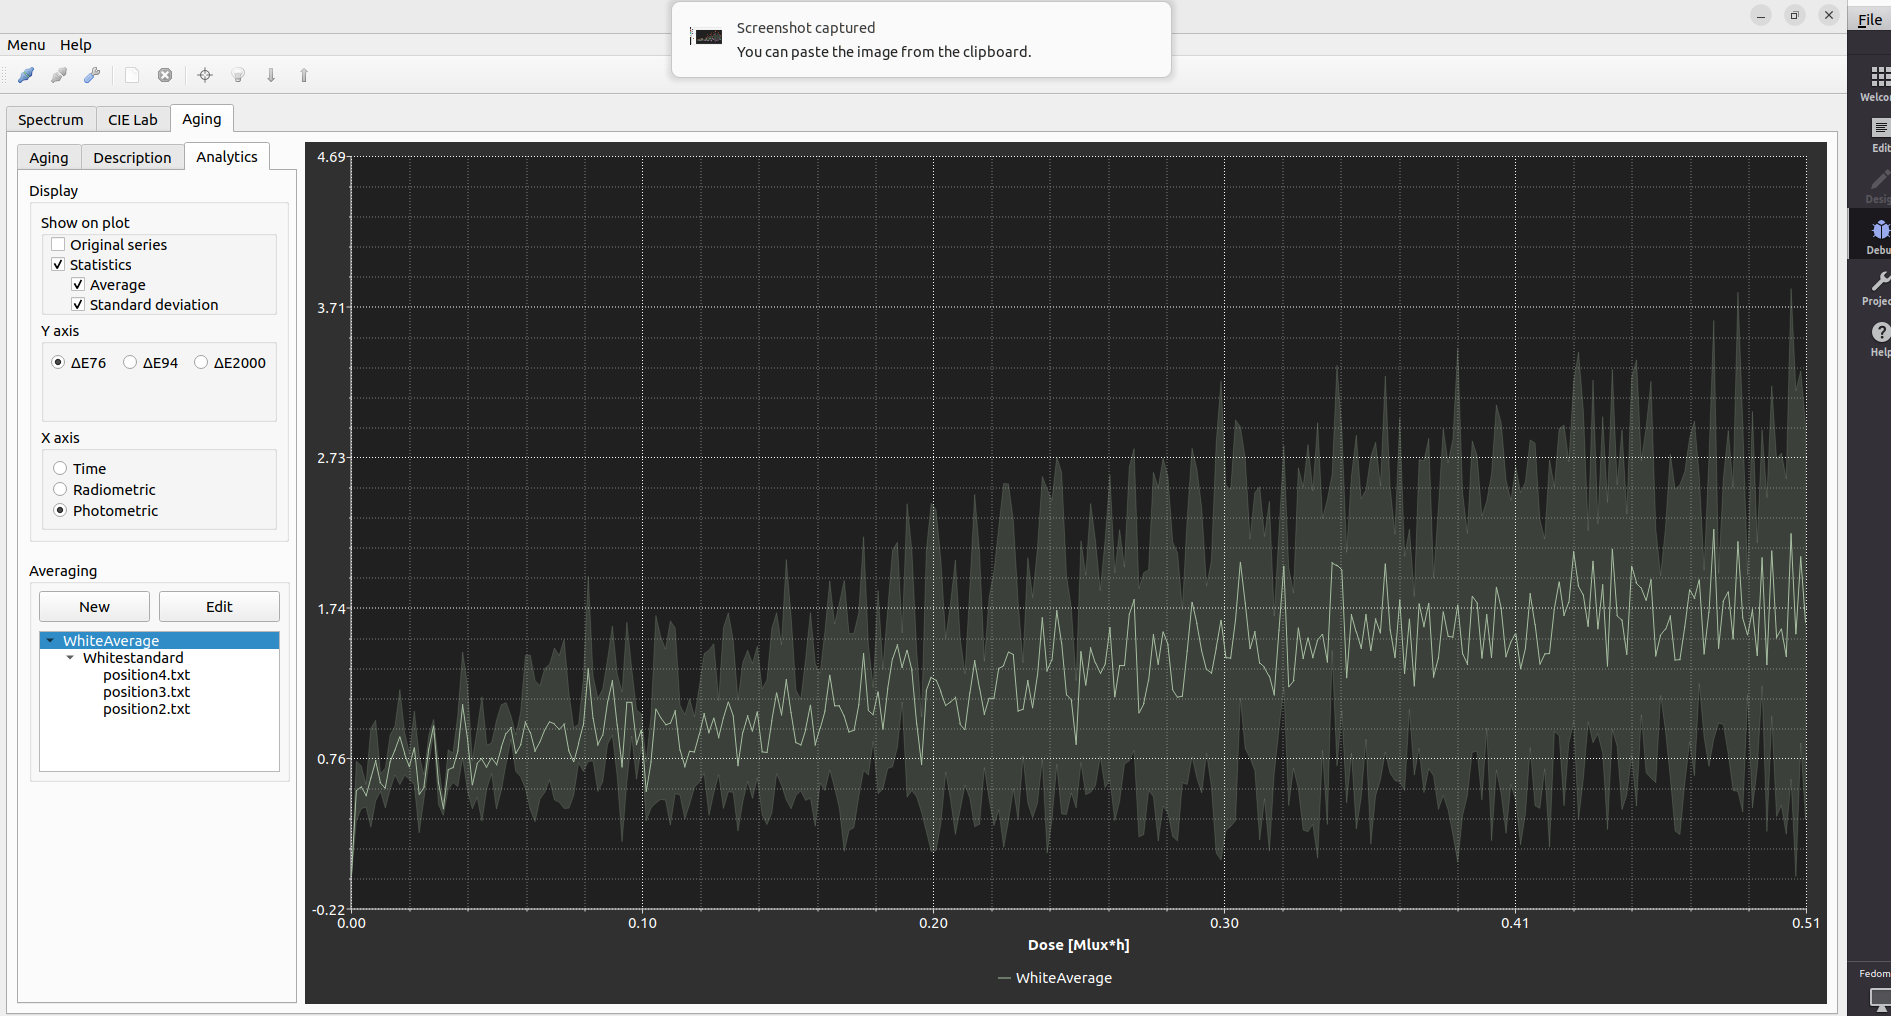
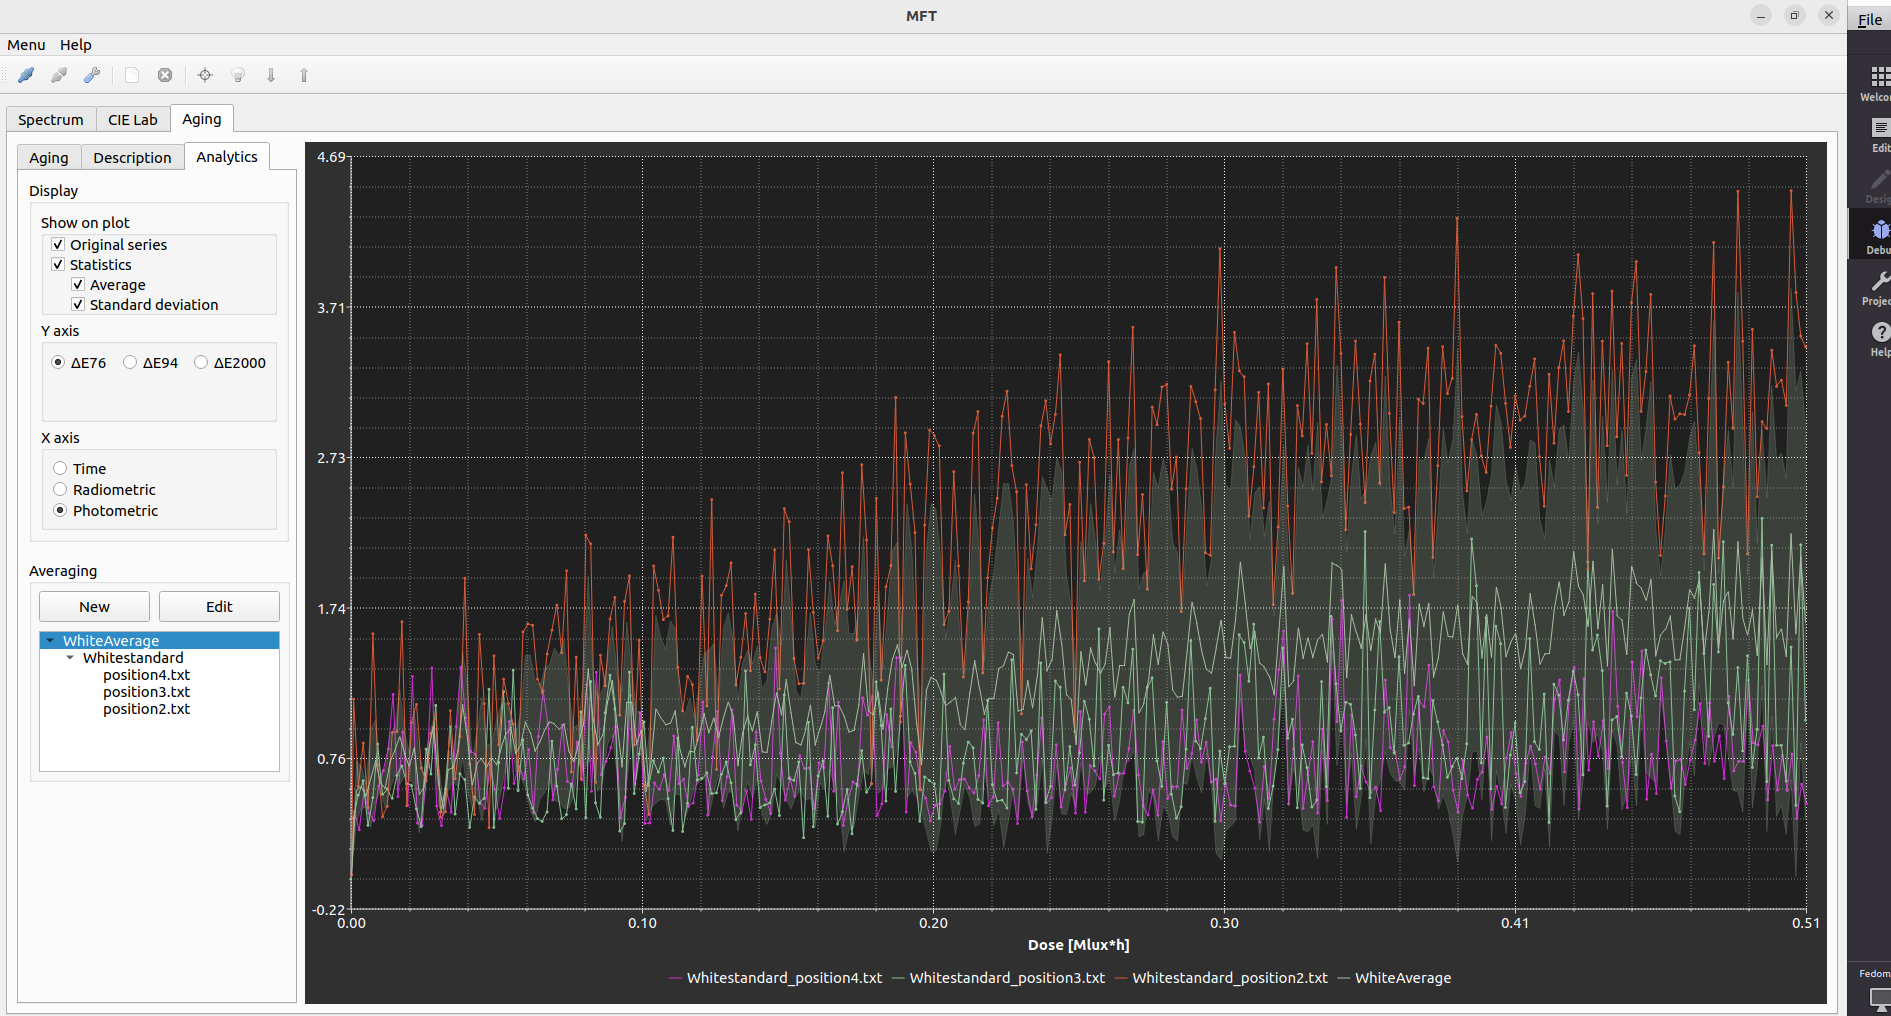
I agree with @jacob-thomas that it is necessary to average DE and the lab values (and DL, Da, and Db). We always use those values not only to compare different spots from an ROI as @jacob-thomas suggests, but also to describe the change (ie, getting darker, yellower, cooler, etc). This is very helpful for conservators and conservation scientists alike so I think it is paramount that we do that. I also like to average DC because it also identifies saturation so averaging that would be of interest to me. The algorithm averages the DE curves and does not rely on an average of the each of the variable first, I understand you correctly, @zbyszek . So it should be okay to look at individual averages to identify descriptive trends.
And @jacob-thomas as for the average of an aggregate, I try to stay away from that because of the many factors that could influence a DE00 value, such as texture, gloss, pigment concentration, etc… So, this is when I do turn to the more qualitative descriptions to discuss areas of similar chemical composition and look to the DL, Da, and Db values a bit more than DE00 itself. I only average areas that are in close proximity to each other in a single ROI rather than all over an object of interest. Also is your aggregate within the SD of the ROI average (and vice versa?) I know Julio and Mario have looked at a mathematical model to correct for the difference between runs. See Mecklenburg MF, del Hoyo-Meléndez JM. Development and application of a mathematical model to explain fading rate inconsistencies observed in light-sensitive materials: Mathematical model to explain fading rate inconsistencies in light-sensitive materials. Coloration Technology. 2012;128:139–46.
Also @zbyszek I am using chrome and I couldn’t download. Thanks to both of y’all!