One of our MFT’s users requested:

_To the team at Instytut Fotonowy,

We are collectively writing to you here as a group of current and future Automated MFT users to respectfully request the addition of an averaging and standard deviation function in the MFT software. As it stands, averaging multiple fading curves from similar areas is a cumbersome activity that requires manually exporting the curve data into a third-party software for treatment. We understand there is a consensus within the MFT team at Instytut Fotonowy about possible issues related to surface homogeneity and averaging, which might not be wholly representative. However, we in our day to day practice, as well as more in depth research studies, greatly benefit from the assessment of uncertainty in the measurement by averaging and standard deviation, particularly when running blue wools and other reference samples. We would argue that it is essential for a meaningful interpretation of the fading data, as illustrated by the many published works in the MFT literature. We hope that you see this function as valuable in the further development of your software and instrumental capability.

Thank you for your consideration._

  • Signed by 12 users

One of the purposes of the Micro Fading Tester is to recognize the most light sensitive areas in the artworks in order to protect them against the light. The result of the averaging operation is that the problem of the most sensitive dye/area, that requires the most care, becomes “dissolved” with more stable dyes. Then, instead of paying attention to the most sensitive areas, one may adapt the exposure policy to the average level, neglecting the most sensitive areas.
Being aware of it, several other questions may arise:

  • Is the user fully aware of that risk? We take into account that a large group of users are more familiar in history of arts, not necessarily in (photo)chemistry or physics, and may not fully understand the result neglecting the most unfavorable readouts.
  • Who will take responsibility for the damaged artworks? Instytut Fotonowy would not like to be blamed for results, that give rise to improper lighting policy and then for fading the painting.

However, we understand that the averaging issue is wanted by the users’ community. We may add it to the next software release.
In the meantime some questions concerning responsibility and awareness should be answered.

    Hello Piotr,

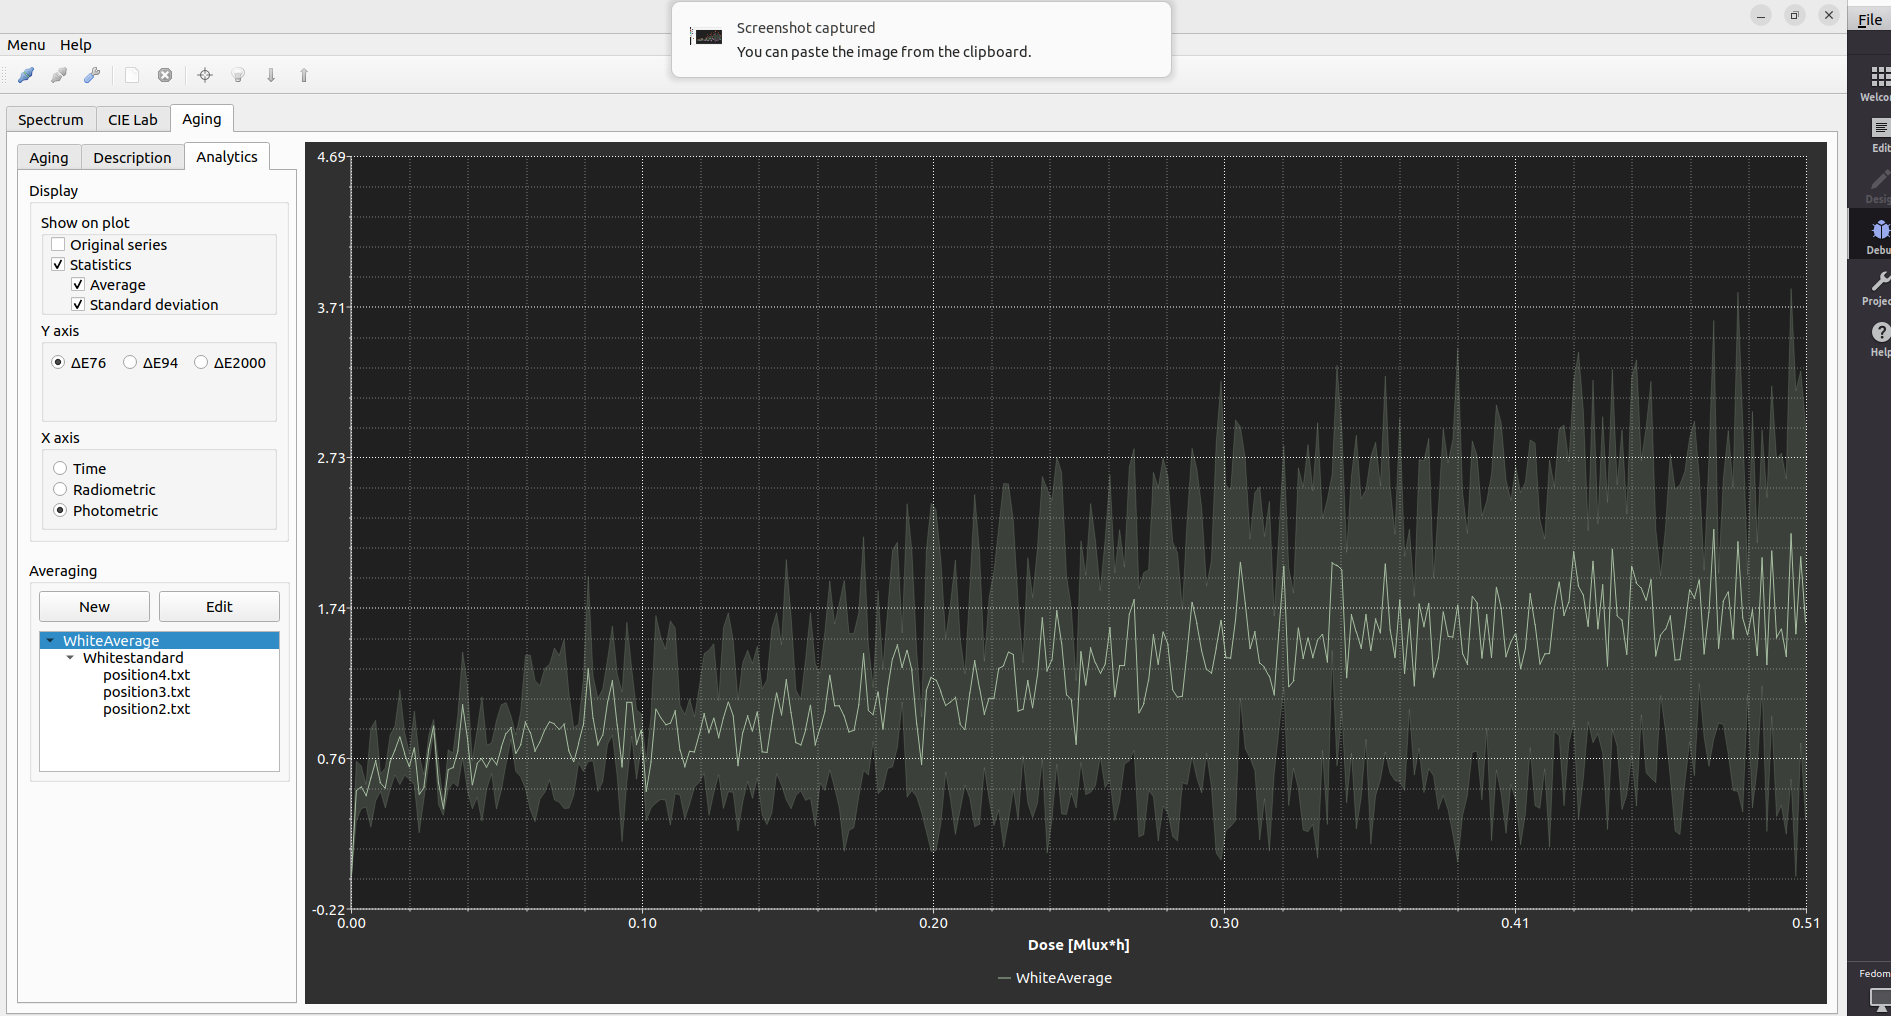
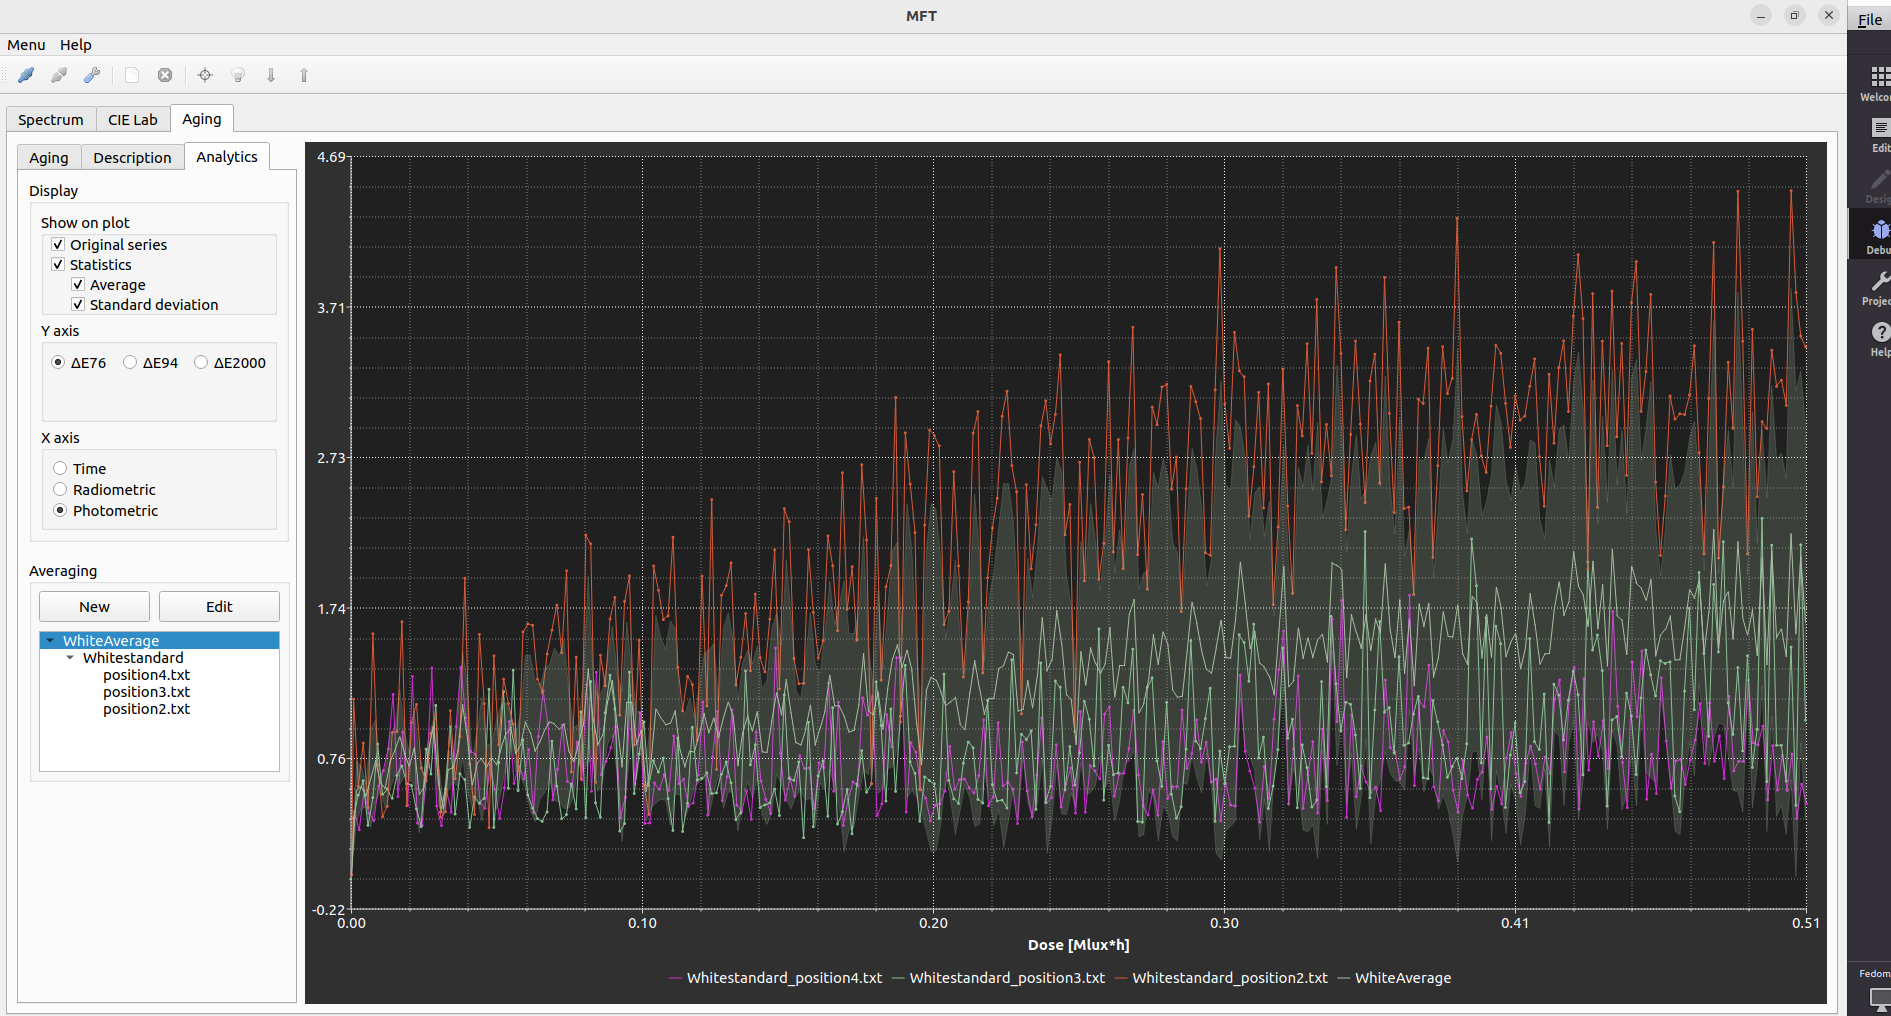
    I think that you might have misunderstood what has been requested. It is common practice to define a region of interest on an object and to collect several measurement points from this ROI. By examining the spectra and the rate of change in Lab values you can be reasonably certain whether or not the colorant is the same, and to then create an average of the colour change data to account for variance.

    I believe what is asked for, or at least what I want the from the software, is the ability to group samples that I believe are the same material and then display the average delta L a b and E for that group of samples.

    I propose that you make a 3 tier sample grouping in the ageing tab.
    Tier one “group” which would correspond to object name,
    Tier two “region of interest” which would correspond to a particular coloured region
    Tier three “sample iteration” which would correspond to individual measurement points

    Tier three would include a check box so that the user can select/deselect sample points for the average and SD calculations. If two or more samples are selected a new plot appears on the graph, “Average of Tier 1-Tier 2-Tier 3”

    The users could then select to use the averaged plots in the report.

    For me this would increase the throughput of using MFT by many fold and would make me a much happier end user as well as distributor.

    best regards,

    Jacob Thomas PhD
    conservation scientist
    MFT enduser and distributor

    Hello everyone,

    Jacob is correct is correct in describing exactly what we would be looking for- a tiered system where we can average readings from multiple areas that are representative of a particular pigment, paint, etc… Introducing uncertainty and variance into measurement acquisition is paramount for our lab at MoMA for the best understanding of the materials possible. It would also be great to be able to export the averaged spectra and associated SD values if further work needs to be done, but as it stands now, we would have to do all of this manually and its very time consuming. Many users I have spoken too have expressed similar frustrations with the software. I agree with Jacob that it would make for happier users and more robust analyses.

    And as it relates to issues with exhibition, I can speak for MoMA when I say that we do not make decisions concerning lighting based on MFT readings alone. We have guidelines that dictate specific conditions for each type of object, and we consider other factors such as age, exhibition history, and others. So this is not point that I would lean heavily on. As for neglecting unfavorable results, that is were looking at variance using SD comes in handy, and many users are aware of how to interpret the statistical significance of large or small SD values.

    Best,
    Abed Haddad
    MoMA

    11 days later

    Thank you for giving us opportunity to improve user experience with the MFT!

    We will add the averaging functionality in the next release of the MFT software.
    You should expected it within about 3-4 months.

    A development version of the software will be available earlier for those who wants to join us in tests.

    Zbigniew Karkuszewski
    Instytut Fotonowy

      19 days later

      zbyszek That is great news! We here at MoMA would love to help with any tests of the new averaging functionality.

      Much appreciated everyone!
      Abed

      4 months later

      zbyszek

      Piotr

      Hello

      Just checking in to see if there has been any update on the averaging feature?

      Thank you!
      Abed

        7 days later

        abedhaddad it turned out that the library we are using for drawing plots is incompatible with the averaging feature and adjusting it would be too much work.
        Instead, we developed a new plotting widget that will be able to handle the averaging.
        The MFT software with the new plots should be released this month.
        The averaging functionality will be done after that.

          5 days later
          2 months later

          Hello @zbyszek @Piotr

          I’m wondering about the progress into the averaging functionality, in addition to the status of the new MFT software. Will we get a new copy as well?

          Thank you 🙂
          Abed

            a month later

            Hi abedhaddad
            We have introduced the new plotting widget to the MFT software. It fixed also couple of issues with reports layout.
            Although still in the devel branch, you can download it from here if you would like help us promote it to the release version.

            The next step is to finally add the averaging features, which, if Gods allow, will be done in about 7 weeks in the devel stage.

            Sincerely,
            zbyszek

              5 days later

              hello Zbyszek 🙂 Thanks for the update and the new software link! I seem to have a little problem downloading it from this cloud link, it gives me an empty response error. Could you share with me via e-mail abed_haddad@moma.org

              Looking forward to using the widget.
              Abed

              zbyszek

              3 months later
              5 days later

              abedhaddad We are on it at last.

              At the moment there is an issue with the averaging approach. The aging curves are not measured at exactly the same points in time. I mean, after you start an aging, the time intervals from one measurement to the next does not be the same in different curves.
              The jitter comes from the operating system itself.
              How would you like us to make an average? If we have an aging curve A and we use its time coordinates for averaging,
              we would have to interpolate all the other curves at those coordinates.
              However, interpolation is kind of averaging already, right? It takes two points and finds a third one in between. And you can treat it as weighted average of the two points.
              So, if we have curves B, C, and D, and we average them with A than there is a mathematical bias right there.
              In a sense, B, C, and D are “more” averaged than A.

              You may think that, for example, taking first average of all the time points (from A, B, C and D) and do interpolation on all of the curves does not remove the bias from the data.

                zbyszek

                @zbyszek

                Hello,

                I see what you mean and I did encounter this problem. So how about 1) fitting each point to a cubic spline and then 2) interpolating the data to a specified time interval that is customizable (every 1 second, 10 seconds, 30 seconds, 60 seconds) to have uniform time intervals across all curves and then 3) averaging the resulting curves to one curve with standard deviation at every resulting point?

                2 months later
                7 days later
                a month later

                Here is a glimpse of the the new functionality of the MFT software

                In the Aging tab there is a sub-tab “Analytics” which will let you compose averages.

                The plot above shows a single average with a Standard Deviation indicated by the semi-transparent shadow.

                And here are the components for the average as well …

                Hi, this looks great! Happy to see this progress- much appreciated for sharing on this forum.

                Will you be able to also average other kinds of data on the Y axis, like DL, a, b, etc..? Do you have an idea of when this version will be rolled out?

                Thanks!
                Abed